


Most restaurant owners look at one number a day: what did we do in sales? That's the least useful question your reports can answer. This guide covers restaurant sales reporting that actually changes decisions — what to read daily, weekly and monthly, and which patterns signal a problem while it's still small.
Key takeaways
- The Z-report closes your day and is what you reconcile cash and card against.
- Daily: net sales, bills, average per cheque, tax, category mix.
- Weekly: labour vs sales, item performance, waste — the operational levers.
- Monthly: food cost %, profit & loss, year-over-year — the strategic view.
- Average per cheque is usually easier to grow than guest count.
The daily close
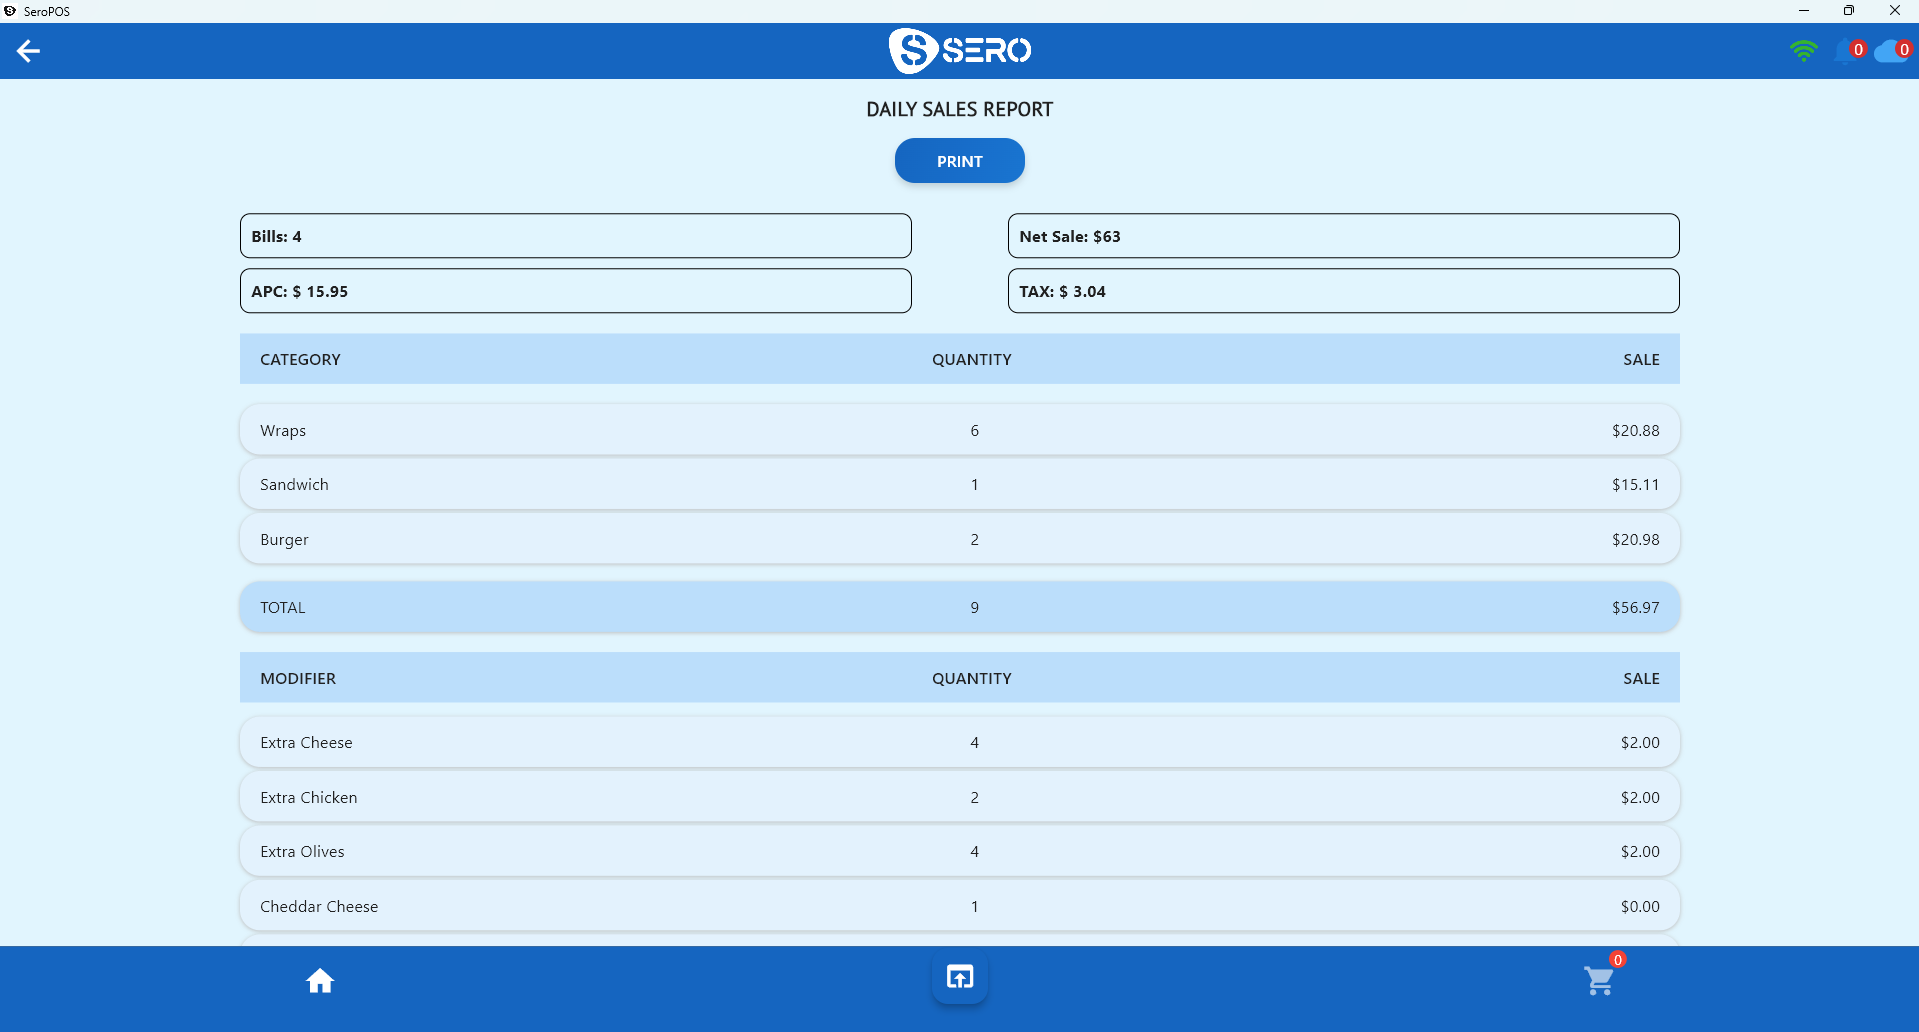
Your daily sales report is the one document to read every single day. A good one shows:
- Bills — how many transactions
- Net sales — revenue before tax
- Tax collected — for remittance
- Average per cheque (APC) — net sales ÷ bills
- Category breakdown — where the money came from
- Modifier breakdown — what extras actually sold
The Z-report
The Z-report (register report) is the close-out: it finalizes the period, totals tenders, and gives you the figures to reconcile against. Your routine should be:
- Run the Z-report
- Count cash — does it match the cash tender total?
- Settle the card batch — does it match the card tender total?
- Investigate any variance tonight, not next week
With integrated payment terminals step 3 is usually automatic, because the POS and the batch derive from the same transactions.
What to read weekly
| Report | Question it answers |
|---|---|
| Sales by day/hour | When are we busy? Are we staffed correctly? |
| Item sales | What's selling, what's dead? |
| Labour vs sales | Is our biggest controllable cost in line? |
| Waste log | What are we throwing away, and why? |
| Sales by staff | Who upsells, who needs coaching? |
The pattern to look for is change, not absolute values. Last Tuesday versus this Tuesday tells you more than either number alone.
What to read monthly
- Food cost percentage — see the full guide
- Profit & loss — the only report that tells you if any of this is working
- Year-over-year comparison — separates real growth from seasonality
- Tax summary — for remittance and your accountant
- Trending products — what's rising and falling over a meaningful window
The four numbers that matter most
1. Net sales. The headline, and the least actionable on its own.
2. Average per cheque. Usually the easiest lever you have. Raising APC from $28 to $31 on 200 covers a day is $600 daily — no extra guests, no extra rent. Drivers: menu design, upselling training, add-on prompts on QR and online ordering.
3. Food cost %. Covered here. If it moves more than two points month over month, something changed — find it.
4. Labour as % of sales. Compare against sales by hour to see whether your schedule matches your demand curve rather than your habits.
Spotting problems early
| Signal | Likely meaning |
|---|---|
| APC falling, covers flat | Upselling slipped, or menu mix shifted down |
| Covers falling, APC flat | Marketing/competition problem, not service |
| Food cost creeping up | Portioning, waste, or supplier prices |
| Void/refund rate rising | Training issue, or something worse |
| One shift consistently lower | Staffing or management gap in that shift |
| Cash variance recurring | Process problem — investigate promptly |
Each of those is a different conversation. The value of reporting is telling them apart.
Habits that make reporting useful
- Read the daily report every day, even when you're tired — patterns only appear in continuity.
- Compare like with like — this Friday to last Friday, not to Tuesday.
- Write down what you changed so you can attribute results later.
- Don't chase noise. One quiet Wednesday is weather; three is a trend.
- Export monthly reports as your own backup regardless of cloud retention.
Multi-location reporting
Running more than one site? Compare the same four metrics per location and investigate the gaps rather than averaging them. See managing multiple locations.
SeroPOS includes 25+ reports — sales, P&L, tax, stock, expiry, register/Z-reports, staff and customer reporting — with Excel and PDF export, and QuickBooks or Xero sync on the Pro plan.
Download SeroPOS and run your first Z-report during the 14-day free trial.