Food cost percentage is the number that decides whether a busy restaurant is also a profitable one. Plenty of packed dining rooms lose money because nobody has recalculated a recipe since the menu was printed. This guide covers the formula, realistic benchmarks, and the five places the money actually leaks.
Key takeaways
- Period formula: (Opening + Purchases − Closing) ÷ Food sales × 100.
- Per-dish formula: Ingredient cost ÷ Menu price × 100.
- Typical targets: 25–32% casual/pizza, 28–35% full service, 35–40% steak & seafood.
- The gap between theoretical and actual cost is your waste, portioning and shrinkage problem.
- Fix leaks before raising prices — but raise prices before cutting quality.
The two calculations you need
Period food cost (the whole operation)
(Opening inventory + Purchases − Closing inventory) ÷ Food sales × 100
Example: $9,000 opening + $22,000 purchases − $8,500 closing = $22,500 used. On $70,000 of food sales, that’s 32.1%.
Plate cost (one dish)
(Ingredient cost ÷ Menu price) × 100
Example: a burger costing $4.10 in ingredients sold at $16.00 is 25.6%.
The period figure tells you what’s happening. The plate figures tell you why. You need both — and the difference between them is where the truth hides.
Benchmarks by restaurant type
| Type | Typical food cost | Notes |
|---|---|---|
| Pizzeria | 25–32% | Dough and sauce are cheap; cheese is volatile |
| Café / bakery | 25–32% | Coffee margins are excellent; pastry waste is the risk |
| Quick service | 28–33% | Volume-driven, tight portioning |
| Casual full service | 28–35% | Broad menu, more waste exposure |
| Steakhouse / seafood | 35–40% | High ingredient cost, high cheque |
| Bar (food) | 28–34% | Beverage margins subsidize |
A number outside these ranges isn’t automatically wrong — but it should be explainable.
The five leaks
1. Portion drift. The most common and least visible. An extra 30 g of cheese per pizza or a heavy hand on the fries costs pennies per plate and thousands per year. Fix with scales, portion tools, and a weighed reference plate.
2. Unpriced modifiers. Every “extra avocado” that rings up free is margin gone. Audit your modifier groups for options priced at $0 that shouldn’t be — see the modifier setup guide.
3. Unrecorded waste. Burnt, dropped, sent-back, and staff meals need a log. Not to eliminate them, but so the unexplained portion of your variance is small enough to investigate.
4. Stale pricing. Supplier costs moved; your menu didn’t. Recost your top ten sellers quarterly and act on what you find.
5. Over-ordering and spoilage. Cash sitting in a walk-in going off. Tighter par levels and proper inventory management fix this.
Theoretical vs. actual: the diagnostic
Your recipes say what the food should have cost (theoretical). Your inventory says what it did cost (actual).
| Gap | Interpretation |
|---|---|
| 0–1 pt | Excellent control |
| 1–3 pts | Normal waste; keep an eye |
| 3–5 pts | Real problem — portioning or waste |
| 5+ pts | Investigate seriously, including shrinkage |
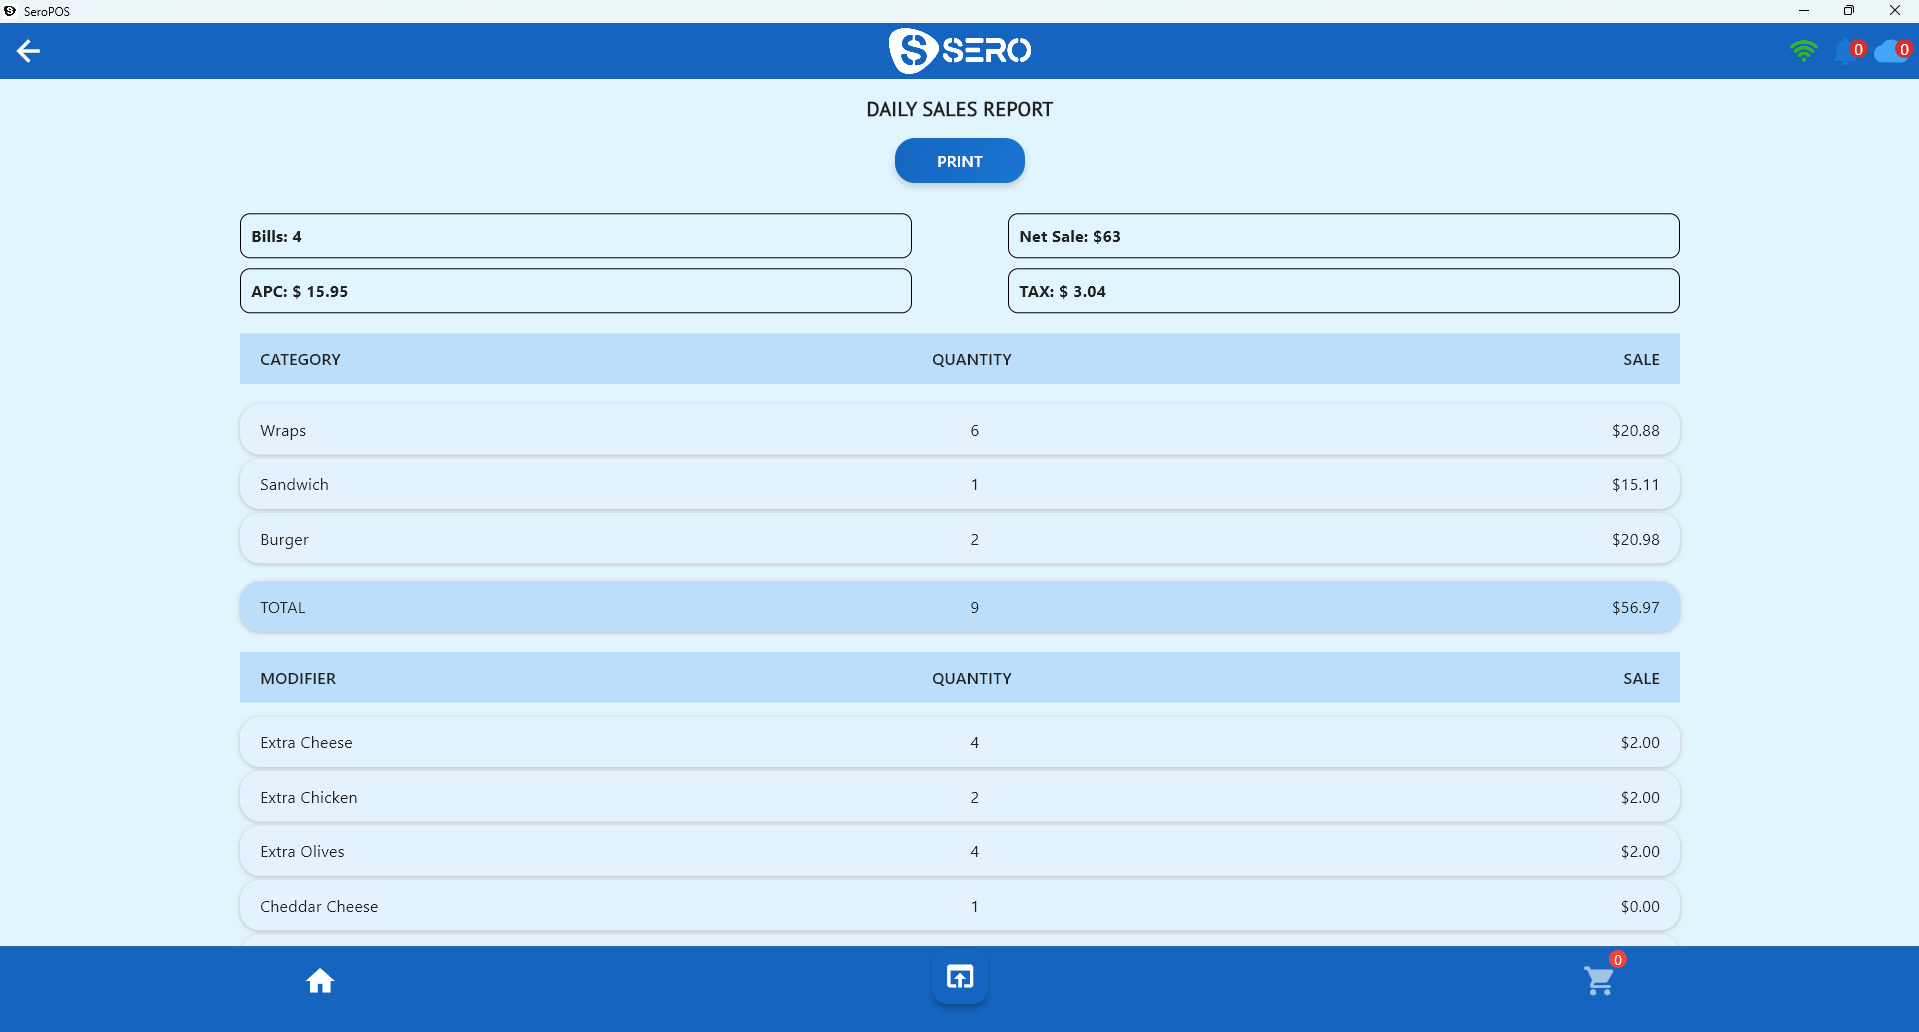
You can only run this diagnostic if recipes exist in your system. On the SeroPOS Pro plan, recipe management stores ingredients, unit costs and portions per dish, so theoretical cost is calculated automatically and ingredient stock depletes as dishes sell.
Menu engineering: the follow-up move
Once you know each dish’s cost, sort your menu into four groups:
| High popularity | Low popularity | |
|---|---|---|
| High margin | Stars — feature them | Puzzles — promote or reposition |
| Low margin | Workhorses — reprice or re-cost | Dogs — cut them |
Most menus carry three or four “dogs” that occupy prep time, inventory space, and menu real estate while contributing almost nothing. Removing them usually improves both your food cost and your kitchen speed.
Raising prices without losing guests
- Move in small increments ($0.50, not $2.00)
- Don’t raise everything at once
- Keep your signature item’s price stable if you can
- Never shrink portions to hide a cost increase
- Refresh the menu design at the same time — new menus reset price anchoring
A monthly routine that takes 30 minutes
- Count inventory on the same day each month
- Calculate period food cost
- Compare against theoretical from your recipes
- Investigate any gap over three points
- Recost your top ten items quarterly
- Adjust prices or portions deliberately, once
Do that consistently for six months and you’ll know your business better than most operators know theirs. Pair it with sales reporting and inventory management, and the picture is complete.
Download SeroPOS and try recipe costing on the Pro plan free for 14 days.