

Restaurant inventory is where profit quietly disappears: over-ordering ties up cash, under-ordering costs sales, and neither shows up on a P&L in a way that tells you what to do. A working restaurant inventory management system doesn't require counting everything constantly — it requires counting the right things consistently.
Key takeaways
- Count high-value, fast-moving items weekly; everything else monthly.
- Set par levels from real usage so ordering stops being a guess.
- Receive against purchase orders — count what arrived, not what the invoice says.
- Log waste; the number matters less than the habit of noticing.
- Ingredient-level tracking (via recipes) turns sales into automatic stock deductions.
Start with the 20% that matters
Most restaurants have hundreds of line items and about twenty that determine their food cost. Proteins, cheese, oil, alcohol — the expensive, fast-moving things. Focus your effort there:
| Tier | Examples | Count frequency |
|---|---|---|
| A — high value/movement | Proteins, cheese, alcohol, seafood | Weekly |
| B — moderate | Produce, dairy, dry goods | Bi-weekly |
| C — low value/slow | Spices, condiments, paper goods | Monthly |
Trying to count tier C weekly is how inventory programs die. Counting tier A weekly is how food cost gets controlled.
Set par levels that reflect reality
A par level is simply: how much should be here before the next delivery?
Par = (average daily usage × days between deliveries) + safety buffer
If you use 12 kg of mozzarella a day and get deliveries twice a week (3.5 days), that's 42 kg plus maybe 20% buffer — a par of about 50 kg. Order to par, not to feeling.
Review pars quarterly and after any menu change. A new dish featuring an ingredient will change its usage overnight.
Receiving: the step everyone rushes
Deliveries arrive at the worst time, and the temptation is to sign and move on. That's how inventory accuracy dies:
- Count against the purchase order, not the invoice.
- Check quality and dates on perishables before signing.
- Note discrepancies immediately — while the driver is still in the building.
- Enter receipt in the system the same day, so stock reflects reality.
- Store immediately with FIFO rotation and clear date labels.
Twenty extra minutes at delivery saves hours of confusion later.
Ingredient-level tracking
Counting cases of cheese tells you what you bought. Recipe-based tracking tells you what you used. When a pizza sells, the system deducts 280 g of mozzarella, 120 ml of sauce, and one dough ball — because you told it what a pizza contains.
On the SeroPOS Pro plan, recipe management lets you:
- Define recipes with ingredients and portions
- Cost each menu item automatically from ingredient prices
- Deduct ingredient stock as menu items sell
- Compare theoretical usage against actual counts
That comparison is the single most valuable number in inventory management — it's your waste, over-portioning and shrinkage, quantified. See food cost percentage for how to read it.
Log waste, honestly
A waste log feels like admin until you find the pattern in it. Record: what, how much, and why (spoilage, error, comp, breakage, staff meal).
Common findings within a month:
- One prep item consistently over-produced
- A garnish that spoils faster than it sells
- A dish with a high error rate — usually a training or menu-description issue
- A supplier whose produce doesn't last
Waste you've measured is a decision. Waste you haven't is a mystery in your food cost.
Reduce waste structurally
- Cross-utilize ingredients. An item used in four dishes rarely spoils; one used in a single slow seller always does.
- Tighten pars on perishables even at the cost of an extra delivery.
- Prep to forecast, not to habit — check what last Tuesday actually sold.
- Use FIFO ruthlessly, with date labels that are legible from across the walk-in.
- Feature aging stock as specials before it becomes waste.
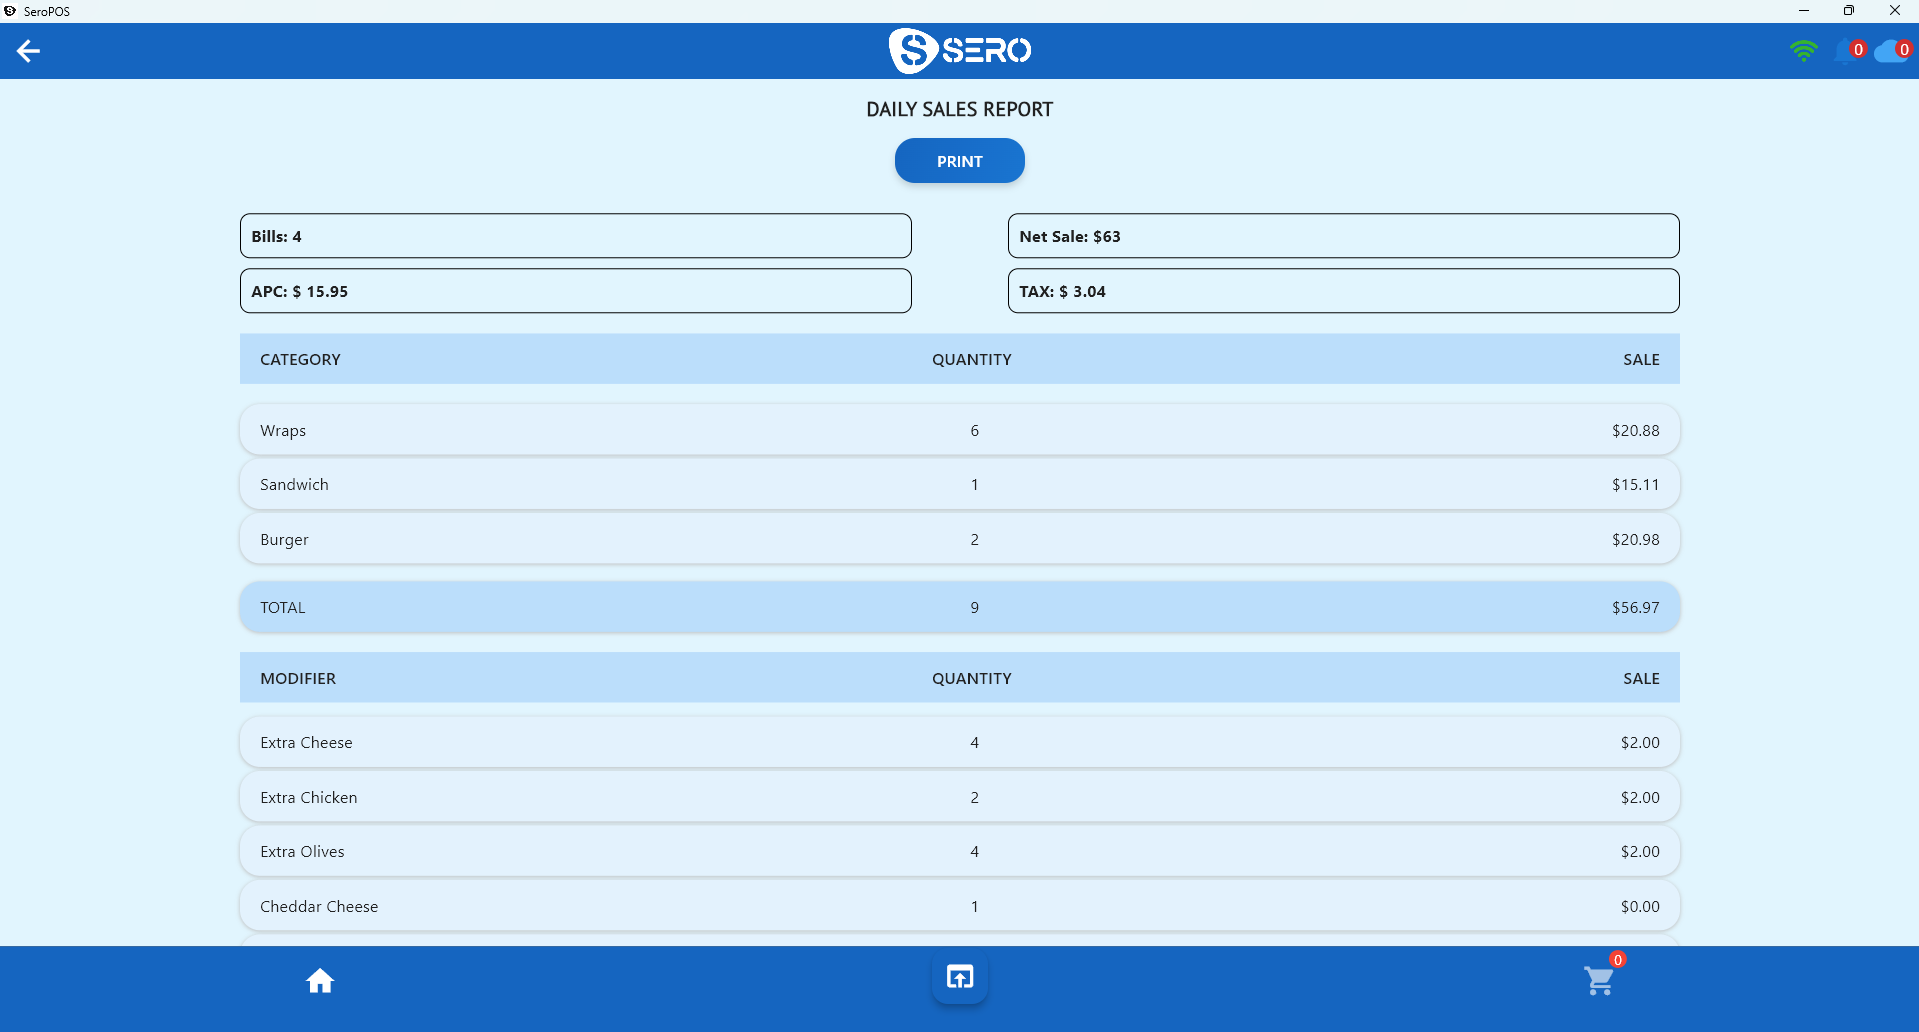
Reports that drive decisions
| Report | Decision |
|---|---|
| Stock report | What to order now |
| Stock expiry / lot report | What to use first |
| Trending products | What to prep more of |
| Purchase report | Supplier price movement |
| Profit & loss | Whether it's all working |
A weekly routine that survives a busy service
- Monday: count tier A items; order to par
- Wednesday: receive delivery against PO; spot-check dates
- Friday: quick tier A recount before the weekend
- Monthly: full count, compare theoretical vs. actual, adjust pars
Thirty to forty minutes a week. It's the difference between knowing your business and hoping.
Multi-location adds one more tool
If you run more than one site, stock transfers let you move inventory between locations rather than emergency-buying at retail prices. See managing multiple locations.
Inventory, recipes, purchase orders and reporting are all included in SeroPOS — download it and try the Pro plan free for 14 days.